Note
Adding a scale bar to a matplotlib plot
When making a geospatial plot in matplotlib, you can use maplotlib-scalebar library to add a scale bar.
[1]:
import geopandas as gpd
from matplotlib_scalebar.scalebar import ScaleBar
Creating a ScaleBar object
The only required parameter for creating a ScaleBar object is dx. This is equal to a size of one pixel in real world. Value of this parameter depends on units of your CRS.
Projected coordinate system (meters)
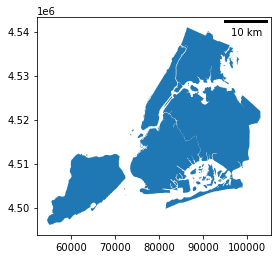
The easiest way to add a scale bar is using a projected coordinate system with meters as units. Just set dx = 1:
[2]:
nybb = gpd.read_file(gpd.datasets.get_path('nybb'))
nybb = nybb.to_crs(32619)  # Convert the dataset to a coordinate
# system which uses meters

ax = nybb.plot()
ax.add_artist(ScaleBar(1))
[2]:
<matplotlib_scalebar.scalebar.ScaleBar at 0x7f89843505b0>

Geographic coordinate system (degrees)
dx should be equal to a distance in meters of two points with the same latitude (Y coordinate) which are one full degree of longitude (X) apart. You can calculate this distance by online calculator (e.g. the Great Circle calculator) or in geopandas.[3]:
from shapely.geometry.point import Point

points = gpd.GeoSeries([Point(-73.5, 40.5), Point(-74.5, 40.5)], crs=4326)  # Geographic WGS 84 - degrees
points = points.to_crs(32619) # Projected WGS 84 - meters
After the conversion, we can calculate the distance between the points. The result slightly differs from the Great Circle Calculator but the difference is insignificant (84,921 and 84,767 meters):
[4]:
distance_meters = points[0].distance(points[1])
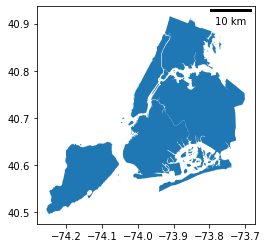
Finally, we are able to use geographic coordinate system in our plot. We set value of dx parameter to a distance we just calculated:
[5]:
nybb = gpd.read_file(gpd.datasets.get_path('nybb'))
nybb = nybb.to_crs(4326)  # Using geographic WGS 84

ax = nybb.plot()
ax.add_artist(ScaleBar(distance_meters))
[5]:
<matplotlib_scalebar.scalebar.ScaleBar at 0x7f894bdace50>

Using other units
The default unit for dx is m (meter). You can change this unit by the units and dimension parameters. There is a list of some possible units for various values of dimension below:
dimension |
units |
|---|---|
si-length |
km, m, cm, um |
imperial-length |
in, ft, yd, mi |
si-length-reciprocal |
1/m, 1/cm |
angle |
deg |
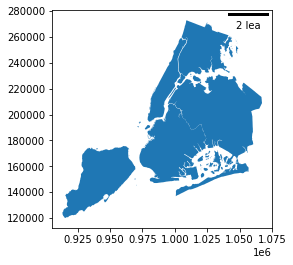
In the following example, we will leave the dataset in its initial CRS which uses feet as units. The plot shows scale of 2 leagues (approximately 11 kilometers):
[6]:
nybb = gpd.read_file(gpd.datasets.get_path('nybb'))

ax = nybb.plot()
ax.add_artist(ScaleBar(1, dimension="imperial-length", units="ft"))
[6]:
<matplotlib_scalebar.scalebar.ScaleBar at 0x7f894bd84f70>

Customization of the scale bar
[7]:
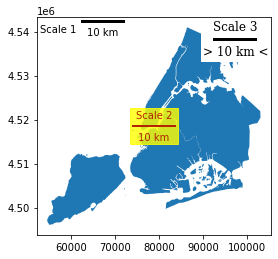
nybb = gpd.read_file(gpd.datasets.get_path('nybb')).to_crs(32619)
ax = nybb.plot()

# Position and layout
scale1 = ScaleBar(
dx=1, label='Scale 1',
    location='upper left',  # in relation to the whole plot
    label_loc='left', scale_loc='bottom'  # in relation to the line
)

# Color
scale2 = ScaleBar(
    dx=1, label='Scale 2', location='center',
    color='#b32400', box_color='yellow',
    box_alpha=0.8  # Slightly transparent box
)

# Font and text formatting
scale3 = ScaleBar(
    dx=1, label='Scale 3',
    font_properties={'family':'serif', 'size': 'large'},  # For more information, see the cell below
    scale_formatter=lambda value, unit: f'> {value} {unit} <'
)

ax.add_artist(scale1)
ax.add_artist(scale2)
ax.add_artist(scale3)
[7]:
<matplotlib_scalebar.scalebar.ScaleBar at 0x7f894bd2b160>
